
Observability: The Skill Every Modern Software Engineer Needs
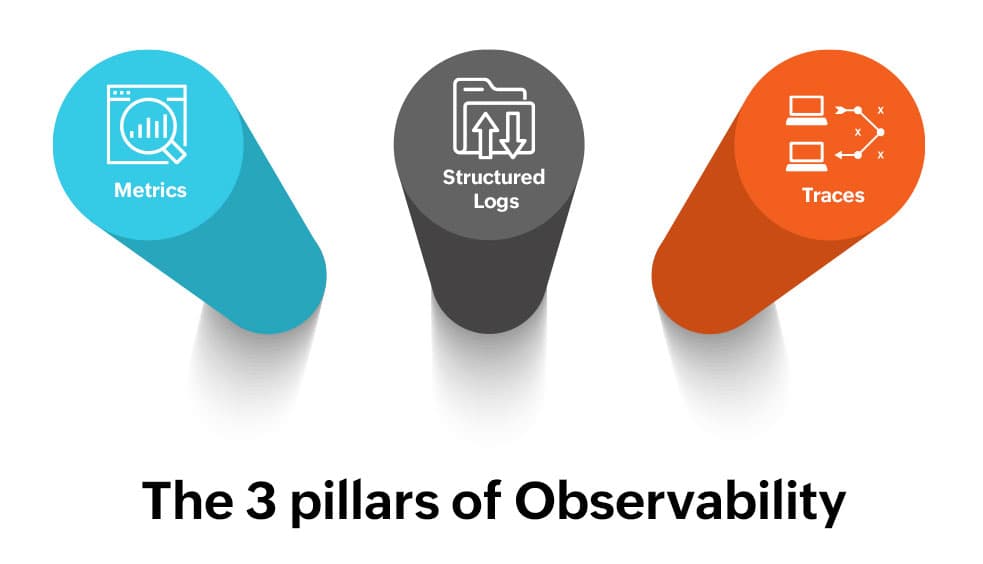
Modern software systems are more distributed and complex than ever, making traditional debugging techniques increasingly insufficient. Observability empowers software engineers to understand what's happening inside their applications through metrics, logs, traces, and other telemetry data—enabling faster troubleshooting, improved reliability, and better user experiences. This article explores the fundamentals of observability, how it differs from monitoring, and why it has become an essential skill for every modern software engineer.
Introduction
Shipping software has never been easier.
Keeping it healthy in production has never been harder.
Modern applications are no longer a single backend connected to a database. They consist of frontend applications, APIs, microservices, containers, cloud infrastructure, third-party services, queues, caches, serverless functions, and edge networks. A single user request may travel through dozens of systems before a response reaches the browser.
When something goes wrong, traditional debugging methods are no longer enough.
This is where Observability becomes essential.
Observability is not just another DevOps buzzword. It is a fundamental engineering capability that enables teams to understand what their systems are doing in real time, diagnose issues quickly, and continuously improve software reliability.
As organizations move toward distributed architectures and cloud-native applications, observability has become one of the most valuable skills a software engineer can learn.
What is Observability?
Observability is the ability to understand the internal state of a software system by examining the data it produces.
Instead of guessing why an application is slow or failing, observability provides the evidence needed to answer questions like:
Why are users experiencing delays?
Which service is causing increased latency?
What changed after deployment?
Why is memory usage continuously increasing?
Which API requests are failing?
How does one customer request travel across the entire system?
A highly observable system allows engineers to investigate problems they didn't anticipate before they occurred.
This is what separates observability from traditional monitoring.
Monitoring vs Observability
These two concepts are often confused, but they solve different problems.
Monitoring answers:
"Do we already know something is broken?"
Examples include:
CPU exceeds 90%
Memory exceeds 80%
HTTP 500 errors spike
API response exceeds 500 ms
Monitoring relies on predefined metrics and alerts.
Observability answers:
"Why is this happening?"
Instead of only notifying engineers that latency increased, observability helps identify:
Which endpoint became slow
Which database query is responsible
Which deployment introduced the issue
Which service dependency failed
Which customer requests are affected
Monitoring detects problems.
Observability explains them.
The Three Pillars of Observability
Modern observability is built around three core telemetry signals.
1. Metrics
Metrics are numerical measurements collected over time.
Examples include:
CPU utilization
Memory consumption
Requests per second
Error rate
Response time
Cache hit ratio
Active users
Metrics are lightweight and ideal for dashboards and alerting.
They answer questions like:
Is traffic increasing?
Are response times getting worse?
Is the database overloaded?
2. Logs
Logs are timestamped records of application events.
Example:
2026-07-15T14:21:33Z

POST /checkout

User: 23981

Payment Gateway Timeout

OrderId: 89231
Logs provide detailed context about what happened.
Good logging includes:
Request IDs
User IDs
Error messages
Stack traces
Metadata
Service names
Without logs, debugging production issues becomes significantly more difficult.
3. Traces
Distributed tracing follows a single request across multiple services.
Imagine a checkout request.
Browser
    ↓
API Gateway
    ↓
Auth Service
    ↓
Cart Service
    ↓
Inventory Service
    ↓
Payment Service
    ↓
Notification Service
Each step records:
Execution time
Parent-child relationships
Errors
Metadata
If checkout suddenly takes six seconds, tracing immediately shows which service consumed the majority of that time.
Tracing is one of the most valuable tools for debugging distributed systems.
Beyond the Three Pillars
Modern observability platforms increasingly incorporate additional signals.
Profiles
Continuous profiling identifies where CPU time and memory are spent.
Instead of only knowing that CPU usage is high, profiling reveals:
Which functions consume the most CPU
Memory allocation hotspots
Garbage collection behavior
Expensive database serialization
Profiling helps optimize performance before users notice slowdowns.
Events
Deployment events, feature flags, infrastructure changes, and configuration updates provide important context.
For example:
2:00 PM
Deploy v3.1

2:02 PM
Latency increased 40%

2:03 PM
Error rate doubled
Events often explain why metrics changed.
Why Observability Matters
Faster Incident Response
Without observability:
Users report the problem first.
With observability:
Engineers detect and investigate issues before customers notice.
Reduced Mean Time to Resolution (MTTR)
Organizations measure how quickly incidents are resolved.
Observability dramatically reduces:
Time to identify
Time to diagnose
Time to recover
Instead of spending hours searching through servers, engineers can pinpoint failures within minutes.
Better User Experience
Performance issues directly impact users.
Studies consistently show that slow applications lead to:
Lower engagement
Reduced conversions
Higher abandonment
Poor customer satisfaction
Observability helps identify bottlenecks before they become business problems.
Confident Deployments
Every deployment introduces risk.
Observability enables teams to answer questions such as:
Did response times increase?
Are errors rising?
Did database load change?
Are users affected?
If problems appear, teams can quickly roll back with confidence.
Data-Driven Engineering
Rather than relying on intuition, engineering decisions can be based on measurable evidence.
Examples include:
Which endpoint should be optimized first?
Which database query needs indexing?
Should another Kubernetes replica be added?
Which feature increases backend load?
Observability transforms opinions into measurable facts.
OpenTelemetry: The Industry Standard
Nearly every modern observability stack starts with OpenTelemetry (OTel).
OpenTelemetry is an open-source framework for collecting:
Metrics
Logs
Traces
It provides standardized instrumentation across different programming languages and frameworks.
Instead of rewriting telemetry every time your observability vendor changes, applications emit telemetry through OpenTelemetry, allowing teams to switch backends with minimal code changes.
Today it is considered the standard for cloud-native applications.
Popular Observability Tools
Many platforms specialize in different areas of observability.
Grafana
Excellent for dashboards and visualization.
Commonly paired with:
Prometheus
Loki
Tempo
Alloy
Prometheus
Industry-standard metrics database.
Excellent for:
Time-series metrics
Alerting
Kubernetes monitoring
Loki
Efficient log aggregation designed to integrate naturally with Grafana.
Tempo
Distributed tracing backend built for Grafana.
Alloy
Grafana's telemetry collector for gathering metrics, logs, traces, and profiles.
Jaeger
Widely used distributed tracing platform.
Zipkin
Lightweight distributed tracing system.
Datadog
Commercial observability platform offering an all-in-one experience with metrics, logs, traces, infrastructure monitoring, and security capabilities.
New Relic
A comprehensive commercial platform focused on application performance monitoring (APM), observability, and real-user monitoring.
Elastic Stack (ELK)
A popular combination of:
Elasticsearch
Logstash
Kibana
Primarily used for centralized logging and search.
Observability for Frontend Engineers
Observability isn't limited to backend services.
Frontend applications generate valuable telemetry, including:
Page load times
Largest Contentful Paint (LCP)
Interaction delays
JavaScript exceptions
Network failures
API latency
User navigation
Session behavior
This enables frontend engineers to understand how real users experience their applications instead of relying solely on local testing.
A Typical Observability Workflow
Imagine a user reports:
"Checkout is extremely slow."
A typical investigation might look like this:
Dashboard shows increased latency.
Metrics indicate response times tripled.
Logs reveal payment gateway timeout errors.
Traces identify the payment service as the bottleneck.
Deployment events show a new release occurred five minutes earlier.
The problematic deployment is rolled back.
Latency returns to normal.
Instead of guessing, every step is backed by evidence.
Why Software Engineers Should Learn Observability
Historically, observability was viewed as a DevOps or Site Reliability Engineering (SRE) responsibility.
That is rapidly changing.
Today's software engineers are increasingly expected to:
Instrument their applications
Write meaningful logs
Export metrics
Create dashboards
Analyze traces
Debug distributed systems
Monitor production performance
Participate in incident response
As cloud-native architectures become the norm, engineers who understand observability stand out because they build software that is not only functional, but also reliable, diagnosable, and maintainable.
Final Thoughts
Writing code is only the beginning of delivering great software.
The real challenge starts after deployment, when applications face real users, unpredictable traffic, infrastructure failures, and changing business demands.
Observability gives engineering teams the visibility needed to understand these systems, troubleshoot issues efficiently, and continuously improve performance and reliability.
Whether you're building a small web application or operating hundreds of microservices, observability turns production from a black box into a source of actionable insights.
In modern software engineering, success isn't defined solely by delivering features—it's defined by delivering software that engineers can understand, maintain, and trust. Observability makes that possible.
Stay in the loop
Get notified when new posts are published. No spam, unsubscribe anytime.
No spam · Unsubscribe anytime